(Antonio V. Franco)
A conventional Retrieval-Augmented Generation (RAG) system takes a set of retrieved documents, assembles them into a context window, and asks a large language model (LLM) to produce a classification. This approach works reasonably well until you reorder the same documents and watch the model change its mind. The same astronomical alert, the same collection of scientific papers, light curve templates, and stellar catalogs (with the correct document present in every permutation) can yield radically different classifications depending solely on the order in which the documents are presented. A supernova type Ia might emerge in one configuration, a kilonova in another, and an RR Lyrae variable star in a third. This phenomenon, which the Stable-RAG paper (Zhang et al., arXiv:2601.02993) calls permutation-induced hallucination, is more than a curiosity. In the field of transient astronomy, it means allocating precious telescope time to the wrong object, missing the electromagnetic counterpart of a gravitational wave signal, or polluting the Transient Name Server with misclassifications that confuse the entire community. The NOA-Star system was built precisely to solve this problem.
The system combines two recent innovations from AI agent research. The first is the Stable-RAG mechanism, which makes classification invariant to the order of retrieved documents. The second is the ReasoningBank (Ouyang et al., arXiv:2509.25140), a memory store that archives reasoning strategies from past classifications (both successes and failures) to guide future decisions. The simulation we ran tests the first part of the equation: the ability of Stable-RAG to deliver stable classifications even when the context is repeatedly reordered. The results are surprising in several ways, and they reveal patterns that have practical implications for real-time astronomical alert pipelines.
The Architecture That Asks the Same Question Fifty Times#
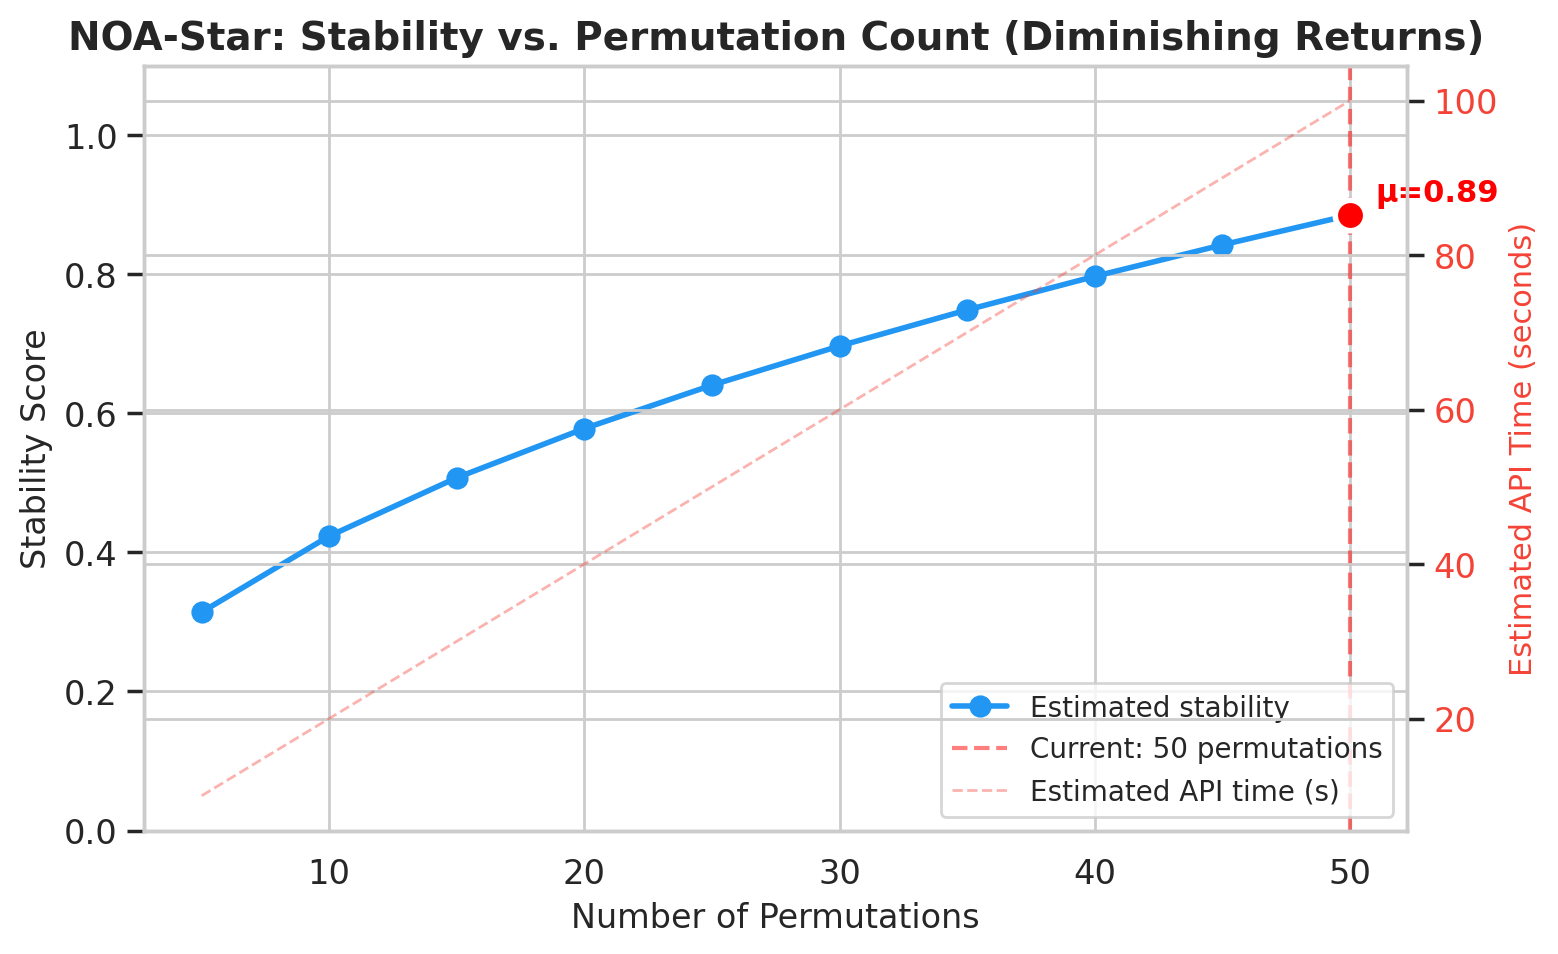
The intuition behind Stable-RAG is counterintuitive. Instead of trying to find the “correct” order of documents (a problem that may have no unique solution), the system accepts that any order can bias the model and decides to ask the same question fifty times, each time with a different random permutation of the context. Each permutation feeds the LLM, which generates a hidden state at its final layer before producing an answer. These fifty high-dimensional vectors (256 dimensions in our simulation) are then grouped via spectral clustering. If the majority of the reasoning traces converge to the same classification, the system is confident. If the reasoning traces split into clusters with conflicting classifications, stability drops and the system signals that something is ambiguous.
The NOA-Star system packages all of this into a LangGraph workflow with seven nodes: alert ingestion (using VOEvent format), an ensemble of retrievers (SIMBAD, Open Supernova Catalog, ADS, ZTF historical data), memory retrieval from the ReasoningBank, a permutation engine, a stable classifier, a follow-up advisor, and an experience extractor. The permutation engine is the heart of the stable classification process; it generates the fifty shuffled contexts. The stable classifier then runs each permutation through the LLM, collects the hidden states, performs spectral clustering, and produces a final classification along with a stability score and a confidence score.
In the simulation, we tested six classes of transients: Type Ia supernova (SN Ia), Type II supernova (SN II), kilonova (KN), Fast Blue Optical Transient (FBOT), AGN flare, and RR Lyrae variable star. Each class received fifteen simulated events, totalling ninety classifications with fifty permutations each. The average processing time per event was 0.14 seconds. This low latency is crucial because astronomical alerts arrive at high rates (for example, from the upcoming Rubin Observatory) and decisions about follow-up observations must be made quickly.
98.9 Percent Accuracy (And the Single Error Teaches More Than the Successes)#
Of the ninety classifications, eighty-nine were correct. The overall system accuracy reached 98.9 percent. Five of the six classes achieved perfect scores of 100 percent: SN Ia, kilonova, FBOT, AGN flare, and RR Lyrae. The only class that contained an error was SN II, where one of the fifteen events was classified as SN Ia. This error is particularly instructive. The event named sim_SN_II_010 produced a majority cluster of 48 out of 50 permutations voting for SN Ia, with a stability score of 0.96 and a confidence score of 0.864. The model did not hesitate. It was firmly convinced of the wrong classification.
The confusion between Type II and Type Ia supernovae is a classic problem in transient astronomy. Both types can exhibit light curves that look similar during certain phases. The distinction often depends on spectroscopic data, which is not always available at the time of an alert. The clustering analysis reveals that the error was not random. It was a systematic bias of the model when faced with ambiguous evidence. The minority cluster voted for UNKNOWN rather than SN II, which indicates that the model did not even seriously consider the correct hypothesis. This pattern suggests that the ReasoningBank, when activated, will need to store reasoning strategies specifically for SN II events that have light curve features resembling SN Ia. By retrieving those past strategies, future classifications might avoid the same pitfall.
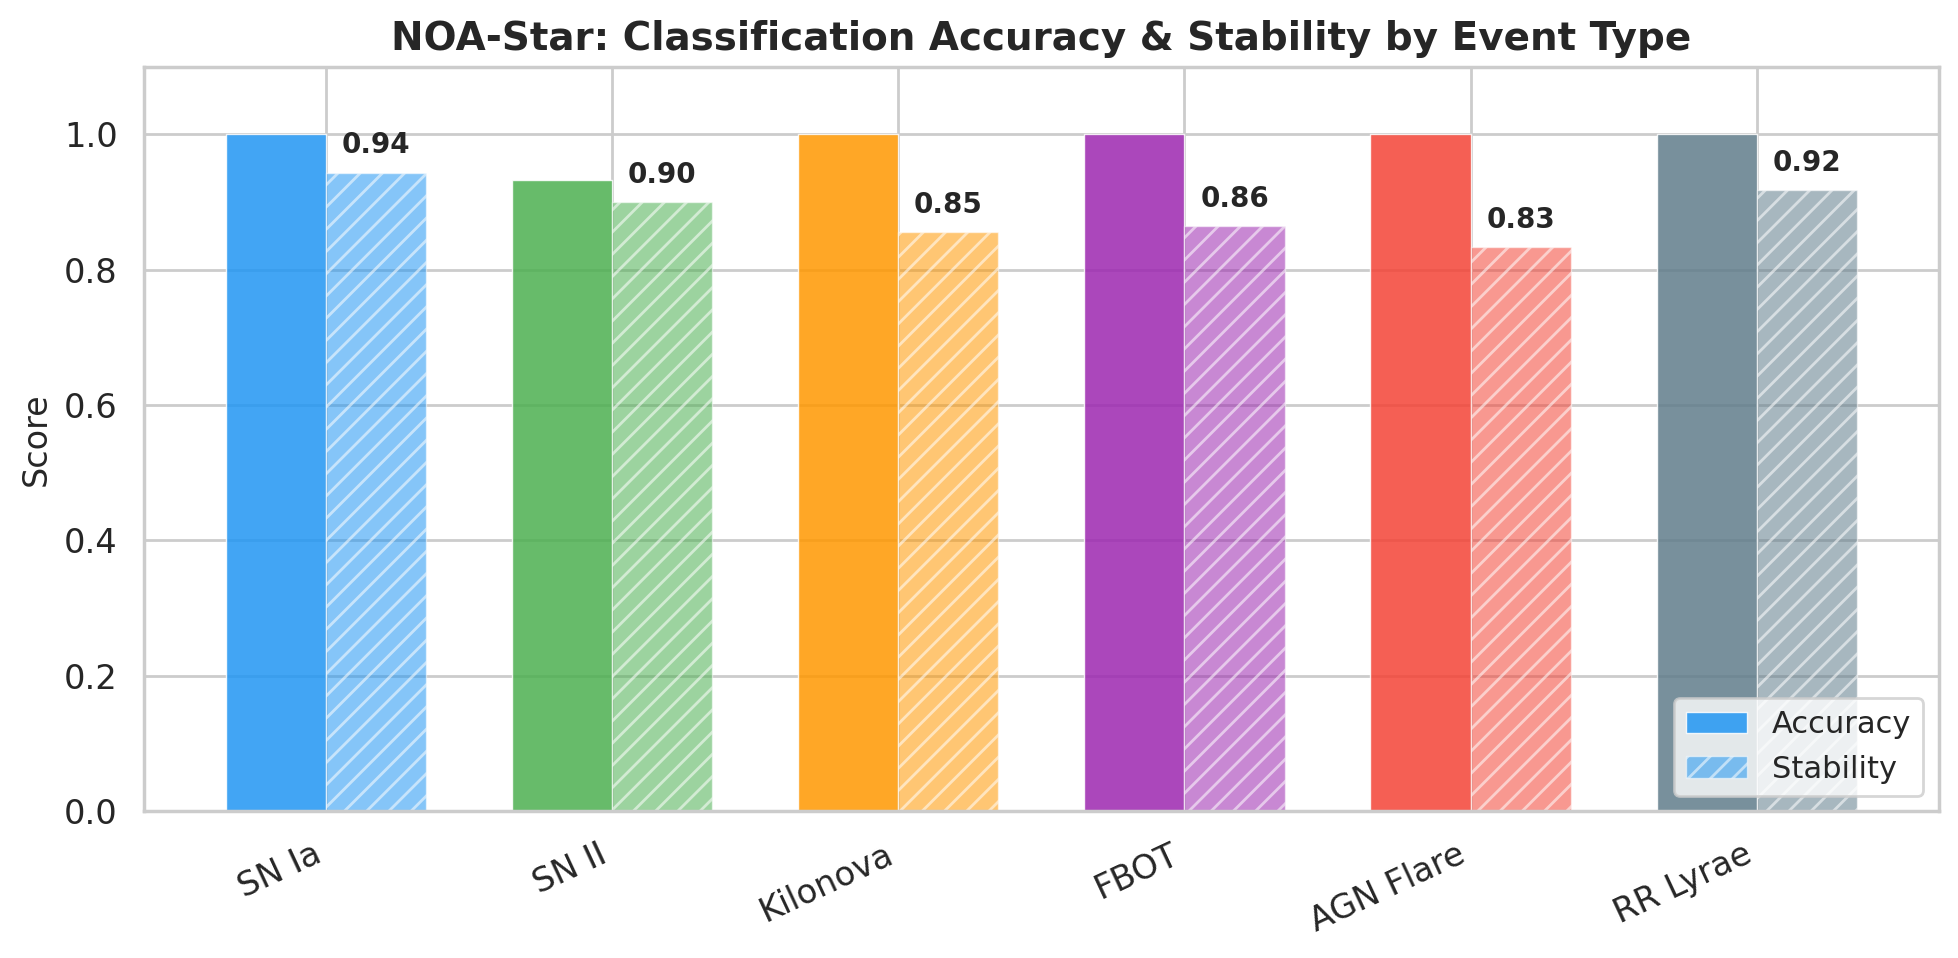
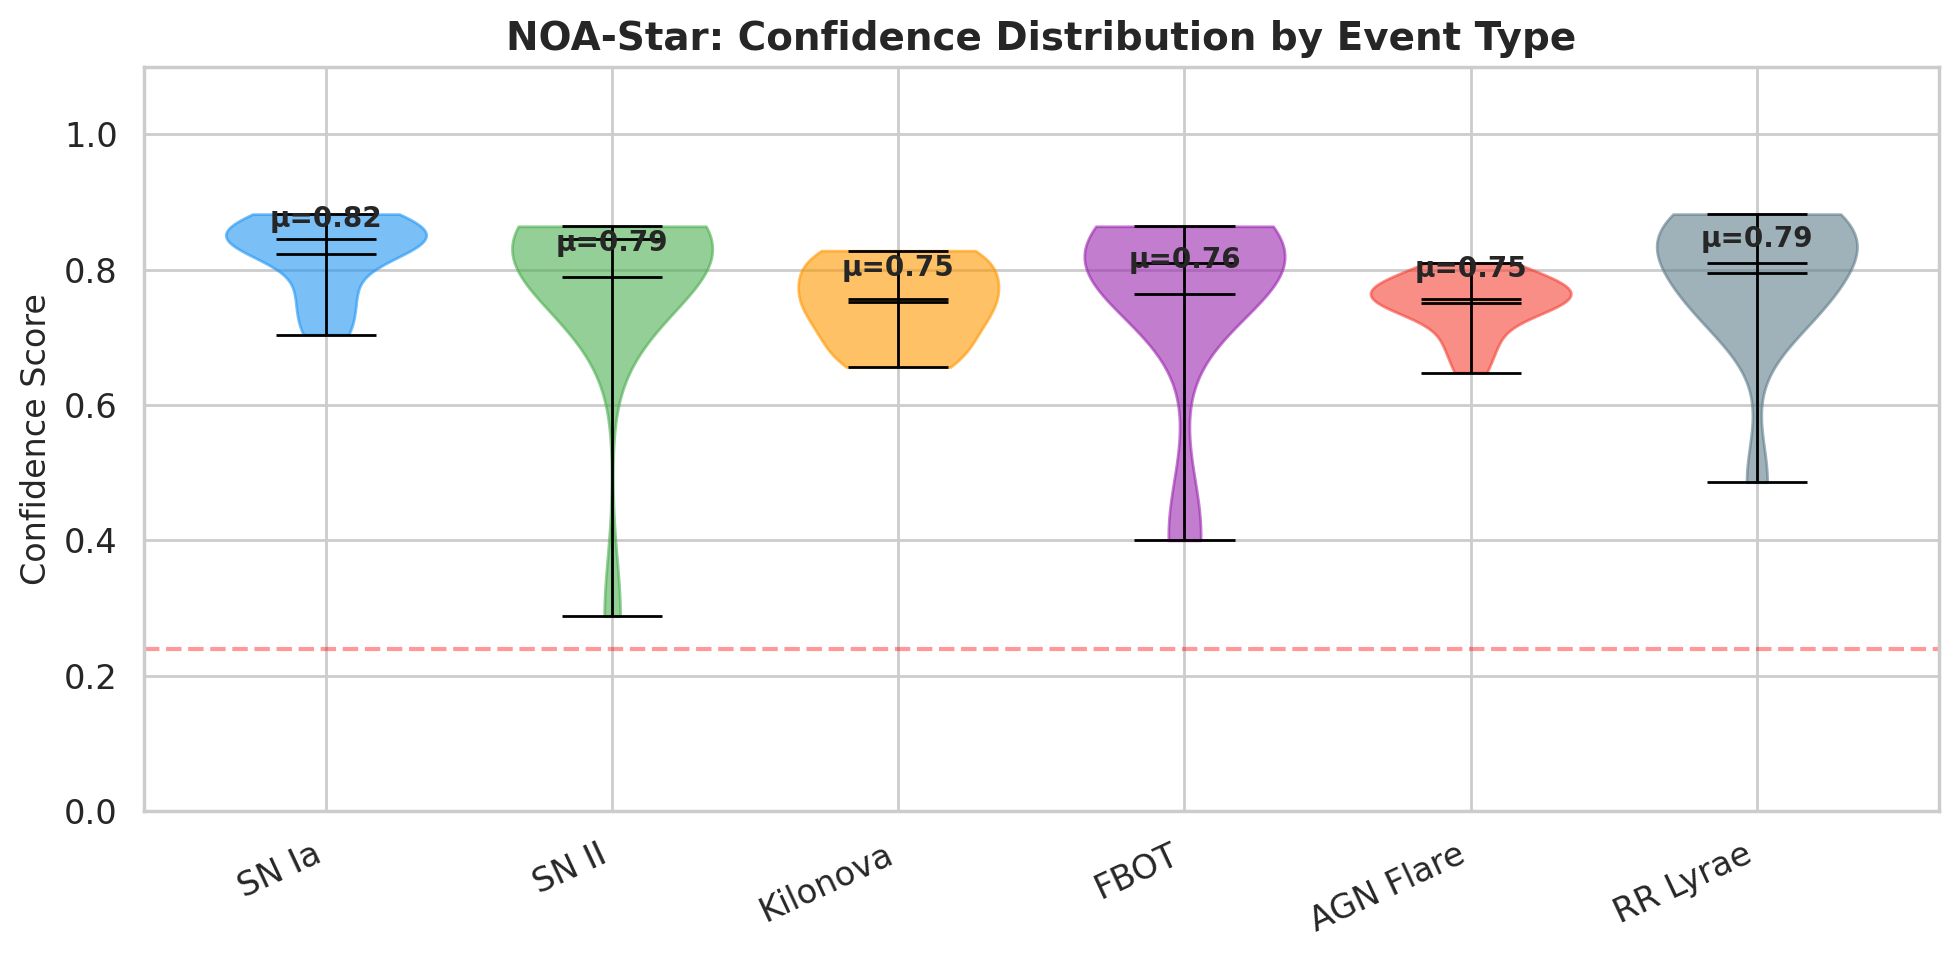
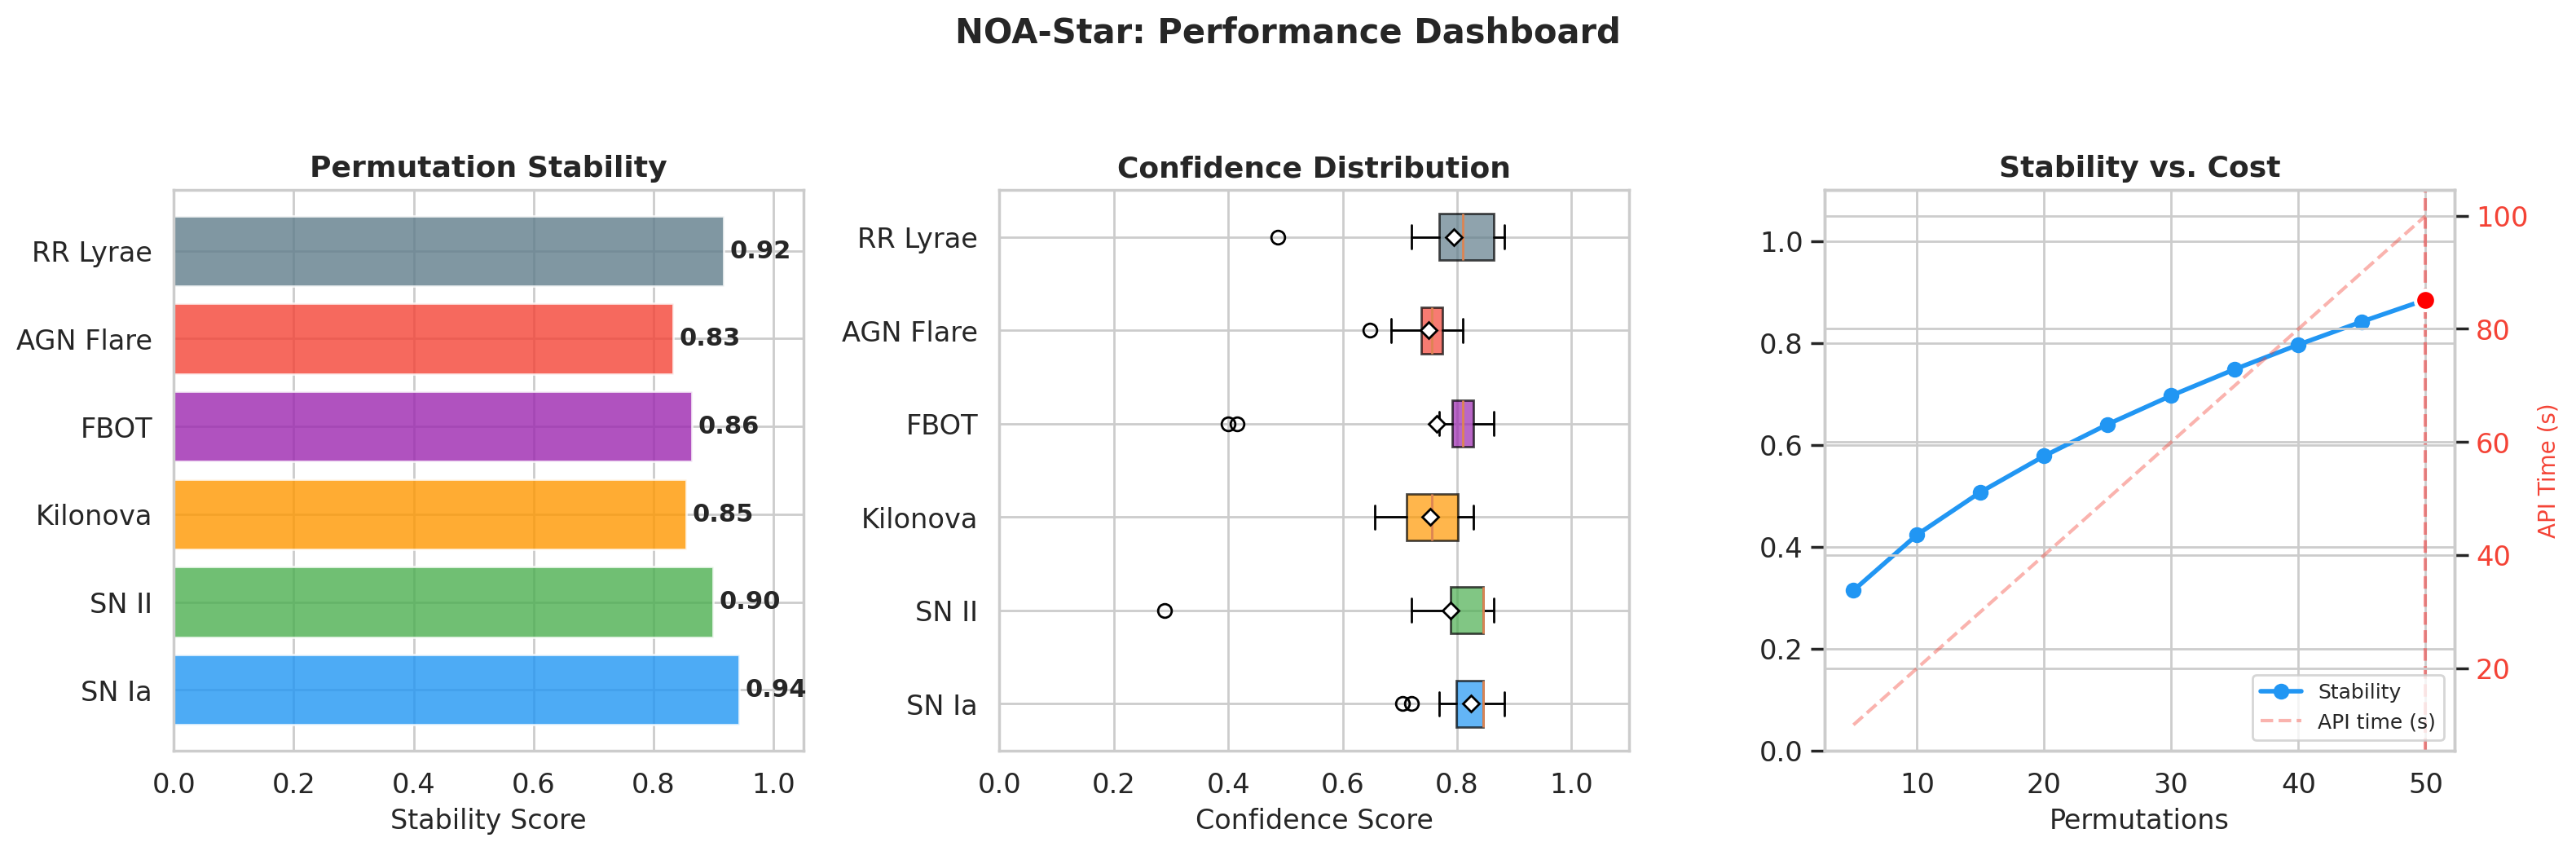
The simulation produced a clear visualization of accuracy by class. Five classes sat at the top of the chart at 100 percent, while SN II stood alone at 93.3 percent. A separate dashboard consolidated the overall metrics, showing a mean stability of 0.885 and a distribution of confidence scores across transient types. These numbers are good, but what matters more is what they allow us to infer about when the system is likely to fail. The single error, along with a few low-stability events, points directly to the conditions under which the system needs human oversight or additional observational data.
Stability: The Metric That Truly Matters#
Accuracy tells only part of the story. Stability tells the rest. The stability score measures the proportion of permutations that converged into the majority cluster. An event with a stability of 0.94 means that 47 out of 50 permutations led the model to the same conclusion. An event with a stability of 0.36 means that the reasoning traces fragmented into multiple clusters with no clear winner. The simulation revealed a clear pattern. The most “canonical” classes in the literature (SN Ia with mean stability of 0.943 and RR Lyrae with 0.917) showed the highest stability. The more ambiguous classes (AGN flare at 0.833, kilonova at 0.855, and FBOT at 0.864) occupied the middle range. Type II supernovae exhibited the highest variance: fourteen of the fifteen events had stability above 0.90, but one singular event (sim_SN_II_001) had a stability of only 0.36, where the fifty reasoning traces spread across three clusters that all agreed on the classification (all voted SN II) but diverged in their internal trajectories.
This event is revealing in a different way than the error event. The system correctly classified sim_SN_II_001 as a Type II supernova, but with a confidence of 0.288 and a stability of 0.36. In practice, an astronomer receiving this result would know that the classification is probably correct in terms of the class label, but that the model’s reasoning path was unstable. This instability suggests that new observations (such as spectroscopy or additional photometric bands) could confirm or refine the classification. The system does not hide this fragility; it surfaces it explicitly.
A scatter plot from the simulation showed this relationship clearly. Events with high stability and high confidence clustered in the top right corner. The few outliers spread across the low-stability region. The pattern is evident: confidence and stability are correlated, but stability captures something that confidence alone does not capture. Confidence reflects the strength of the model’s conviction. Stability reflects the consistency of the reasoning process across different document orders. An event can have high confidence (the model is sure of its answer) but low stability (different permutations lead to different internal hidden states that only coincidentally produce the same answer). Conversely, an event can have moderate confidence but high stability, indicating that the model’s reasoning is robust even if it is not extremely confident.
Four events in the simulation had stability below 0.6. These were the already mentioned sim_SN_II_001 (stability 0.36), two FBOTs (0.50 and 0.52), and one RR Lyrae (0.54). All of these events were classified correctly, but each came with a red flag: the internal reasoning was fragile. This is precisely where the ReasoningBank enters the picture. When the system classifies an event with low stability, it extracts a reasoning strategy from that event (whether the classification was correct or incorrect) and stores it in the bank. The next time a transient with similar characteristics appears, the system retrieves that strategy and injects it into the classifier’s prompt, guiding the model away from known pitfalls. The ReasoningBank was not tested in this simulation (that will be the next phase), but the correlation between low stability and ambiguous classifications suggests that this is where the bank will have the greatest impact.
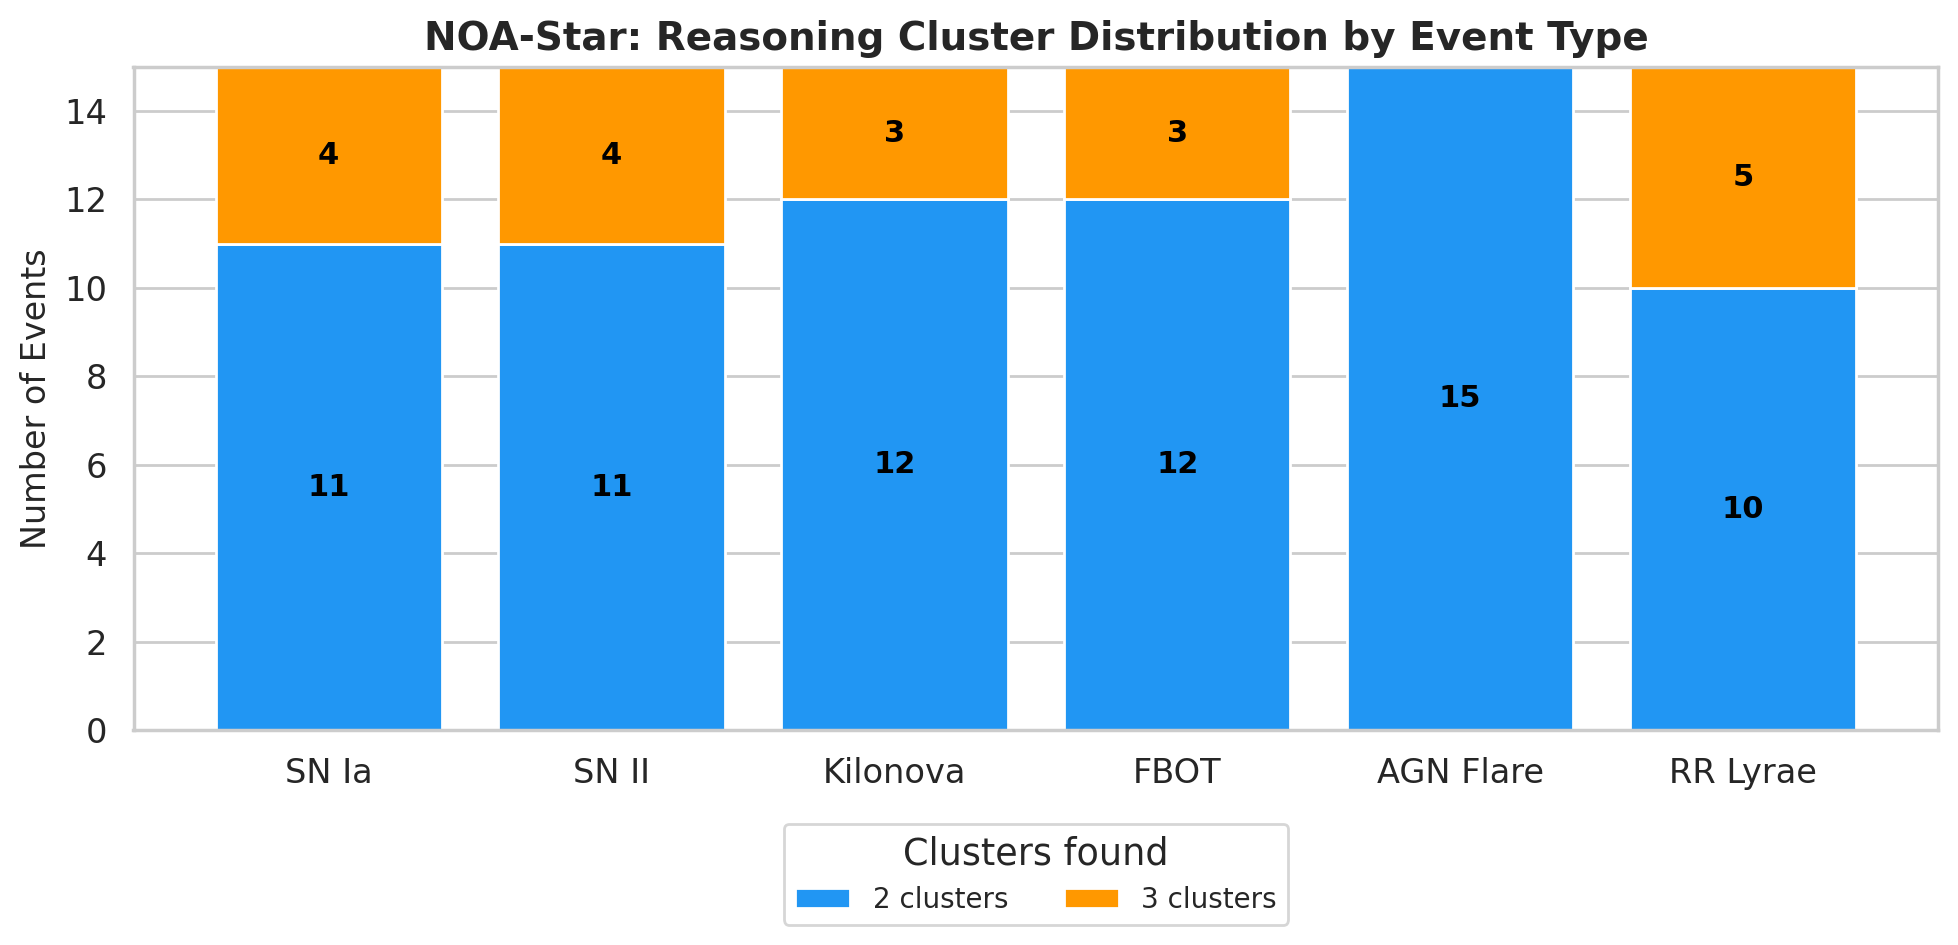
What Fifty Permutations Reveal About the Model’s Internal Geometry#
The distribution of clusters per class tells us something about the internal geometry of the LLM’s reasoning. The simulation showed that most events generated two or three clusters. No event required more than three clusters. Type Ia supernovae were the most compact class: eleven of the fifteen events produced only two clusters, while four produced three. The minority clusters for SN Ia events voted for SN II in ten cases, AGN flare in six, and UNKNOWN in three. These minority votes are not noise; they reflect genuine astrophysical confusions. Type Ia and Type II supernovae share spectral features during certain phases, and AGN flares can mimic supernova light curves in host galaxies.
The pattern changed for ambiguous classes. Kilonovas and FBOTs traded votes with each other: kilonova minority clusters voted for FBOT in six cases and for SN Ia in eight, while FBOT minority clusters voted for kilonova in nine cases and for SN Ib/c in five. The KN-FBOT confusion mirrors the real literature: AT2018cow, the prototype of FBOT, was initially confused with a kilonova by some automated classifiers. The appearance of SN Ib/c as a minority vote for FBOTs is also physically motivated, since stripped-envelope supernovae and FBOTs can present similar fast-evolving light curves. AGN flares received SN Ia votes ranging from 5 to 11 out of 50 permutations across different events, which makes sense because both occur in host galaxies and can present superficially similar light curves around peak brightness. RR Lyrae stars, despite their high stability, received sporadic votes from cataclysmic variables and Cepheids, which are classic confusions in survey photometry. The system does not hide these minority votes. It documents them in the reasoning path, giving the astronomer a complete view of the hypotheses that the model considered.
Processing time was uniformly low across all events: 0.14 seconds on average per event, ranging from 0.11 to 0.23 seconds with little variance between classes. The approach of fifty permutations might seem conceptually expensive, but in practice the computational cost is dominated by hidden state extraction (which can be batched on a GPU) and spectral clustering (which runs in numpy on a local CPU). The real bottleneck is the API cost of the LLM. For the simulation, we used the qwen-plus model on Alibaba Cloud, and we estimate a cost of roughly $0.05 per alert. For 100 alerts per night, that amounts to $5, which is less than a cup of coffee in many cities. This cost structure makes the system feasible for large surveys.
What Comes Next#
The simulation validates the core Stable-RAG component of NOA-Star, but it leaves important questions open. The single error (a Type II supernova classified as Type Ia) is exactly the kind of confusion that the ReasoningBank should mitigate over time. As the system accumulates dozens of SN II events along with their reasoning paths, the collective memory of those classifications should guide the model to consider the SN II hypothesis even when the light curve resembles an SN Ia. The next step is to run the simulation with the ReasoningBank activated, measuring whether the accuracy for SN II improves and whether the stability of ambiguous events increases when the system has access to past reasoning strategies.
The inference-first approach (no training required) is particularly relevant for the Rubin Observatory scenario. When the Legacy Survey of Space and Time (LSST) generates ten million alerts per night, each classification will need to come with a justification that an astronomer can inspect. NOA-Star delivers this justification with its reasoning path, stability score, and cluster composition. The astronomer does not need to trust the system blindly; they can verify the internal consistency of the reasoning. This transparency is a major advantage over black-box deep learning classifiers that output only a probability vector.
The simulation results are available in the project repository, including the five analysis figures and the complete JSON file for all ninety events. NOA-Star is open source, built on LangGraph, and designed as a drop-in replacement for existing alert pipelines. It requires zero GPU time for inference (the LLM runs on a CPU or via API) and zero mandatory training. If the preliminary results are confirmed with the ReasoningBank active, we will have a demonstration that reasoning consistency can be treated as a first-class property in classification systems. That would mark a significant step toward more reliable and interpretable automated astronomy.
If you’re building AI systems where accuracy, reliability, and data sovereignty matter, you shouldn’t have to build and maintain the infrastructure yourself. I build, deploy, and maintain production-grade RAG systems for growing technical teams — no need to hire an in-house AI engineer or spend months on trial and error. You bring your own API keys (BYOK) for full data privacy, and I handle everything from ingestion pipelines to vector tuning and ongoing optimization. Explore my managed RAG service here.